PRICEPhysics GUI Subscription
& Trading Room
$199.00 / Month OR $1990.00 / Year
For Instruments: Futures, Stocks, Bonds
Trading Style: Daily, Intraday, Swing
Platform: NinjaTrader 8
What is PRICEPhysics?
PRICEPhysics is pure organic intelligence, a science based on the absolute components of the unique price movement on each price chart where it is applied. PRICEPhysics will teach you to read the price flow of any chartable instrument just like you are reading this sentence. After your purchase, you will be given the ability to download the PRICEPhysics GUI and a PDF of “The Science & Logic of Chart Reading” by William Schamp which will break down what these absolute components are and how they show you where price is moving.
What is the PRICEPhysics™ GUI?
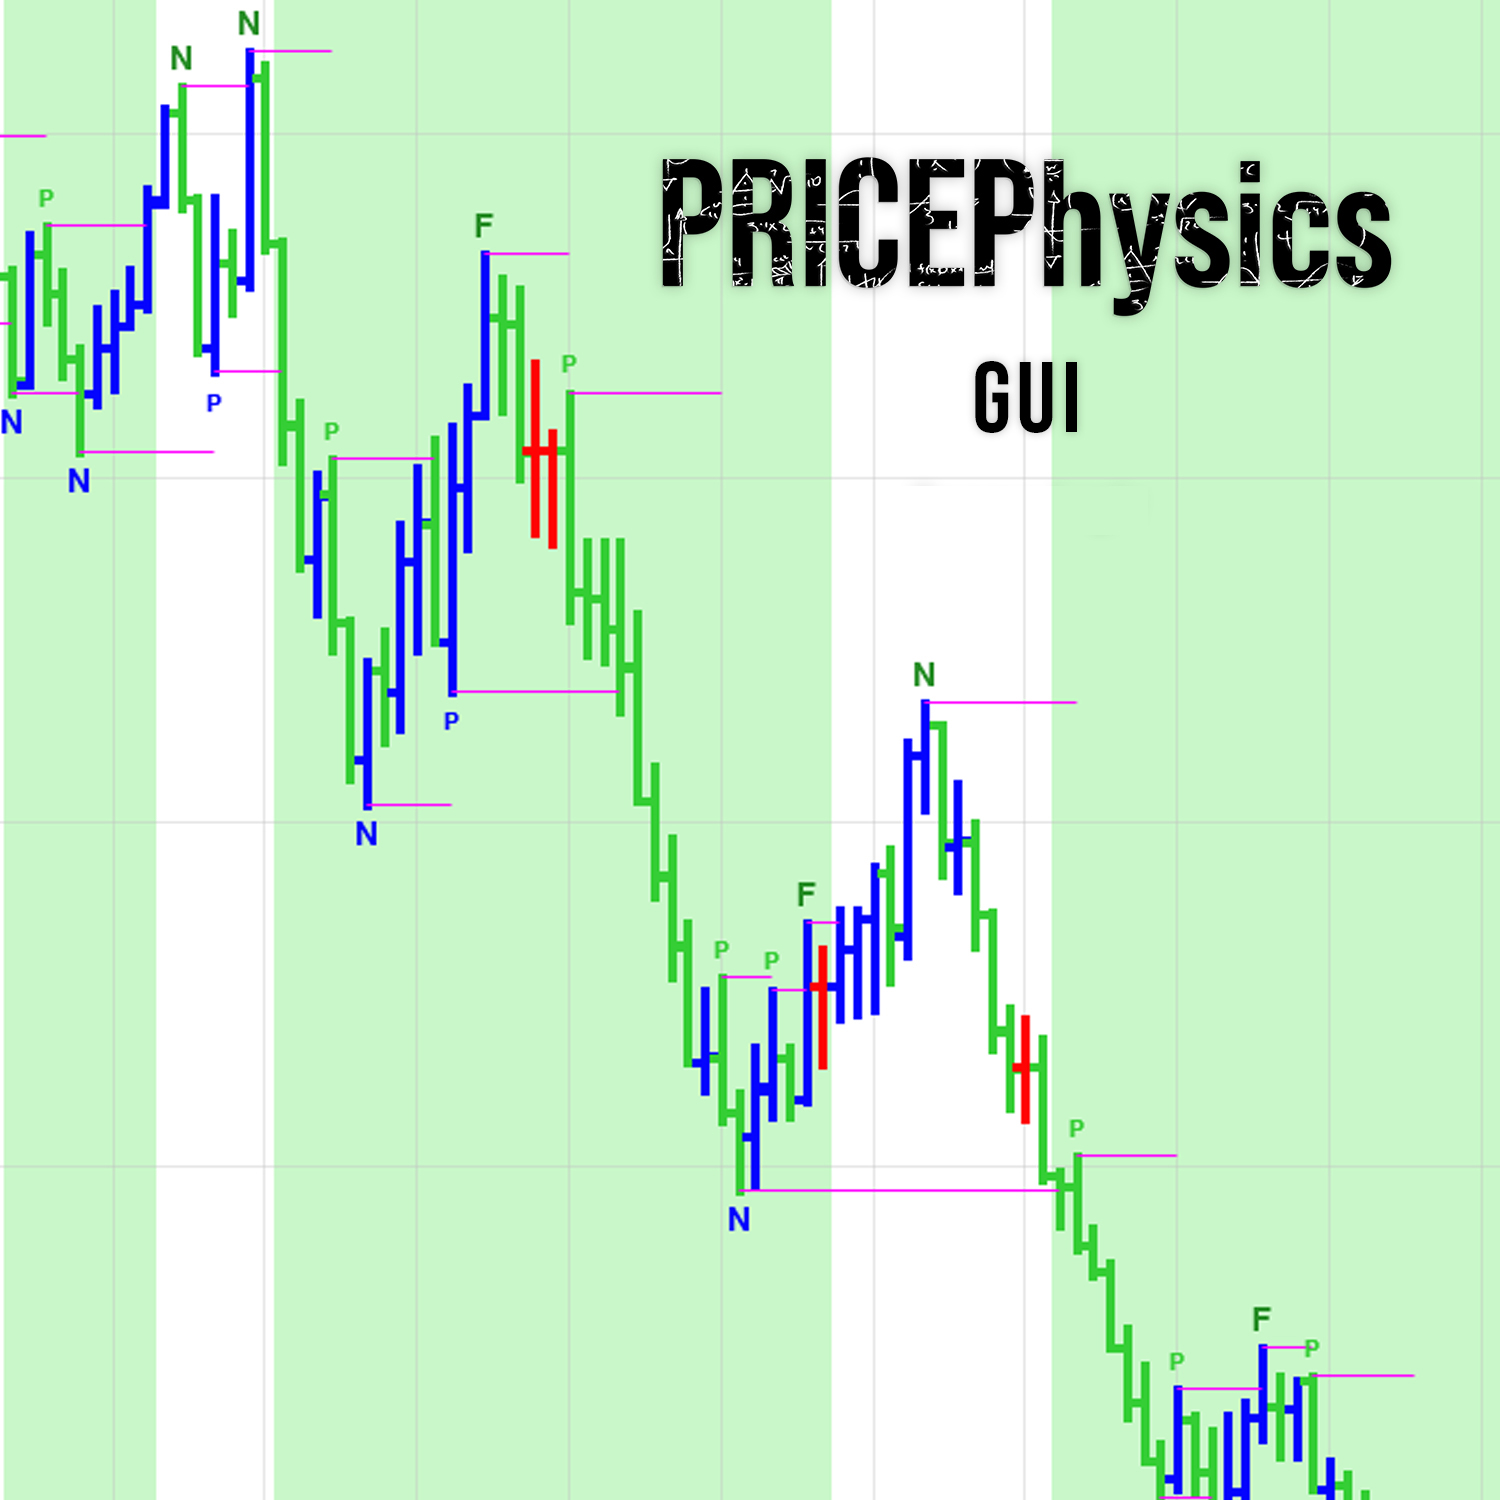
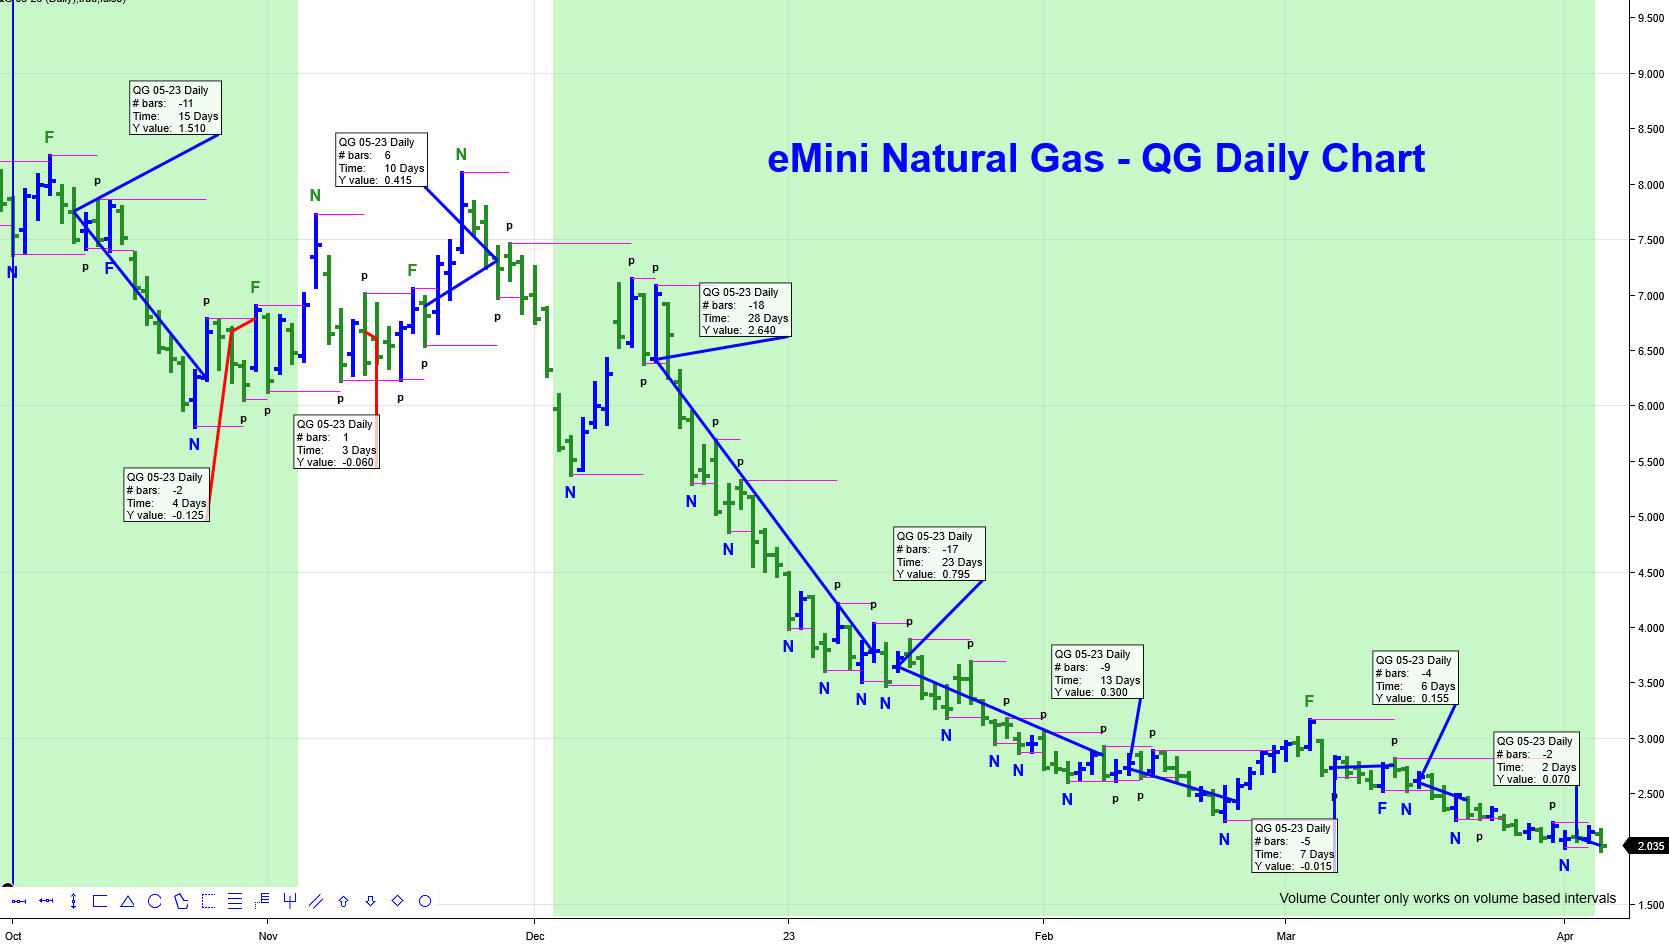
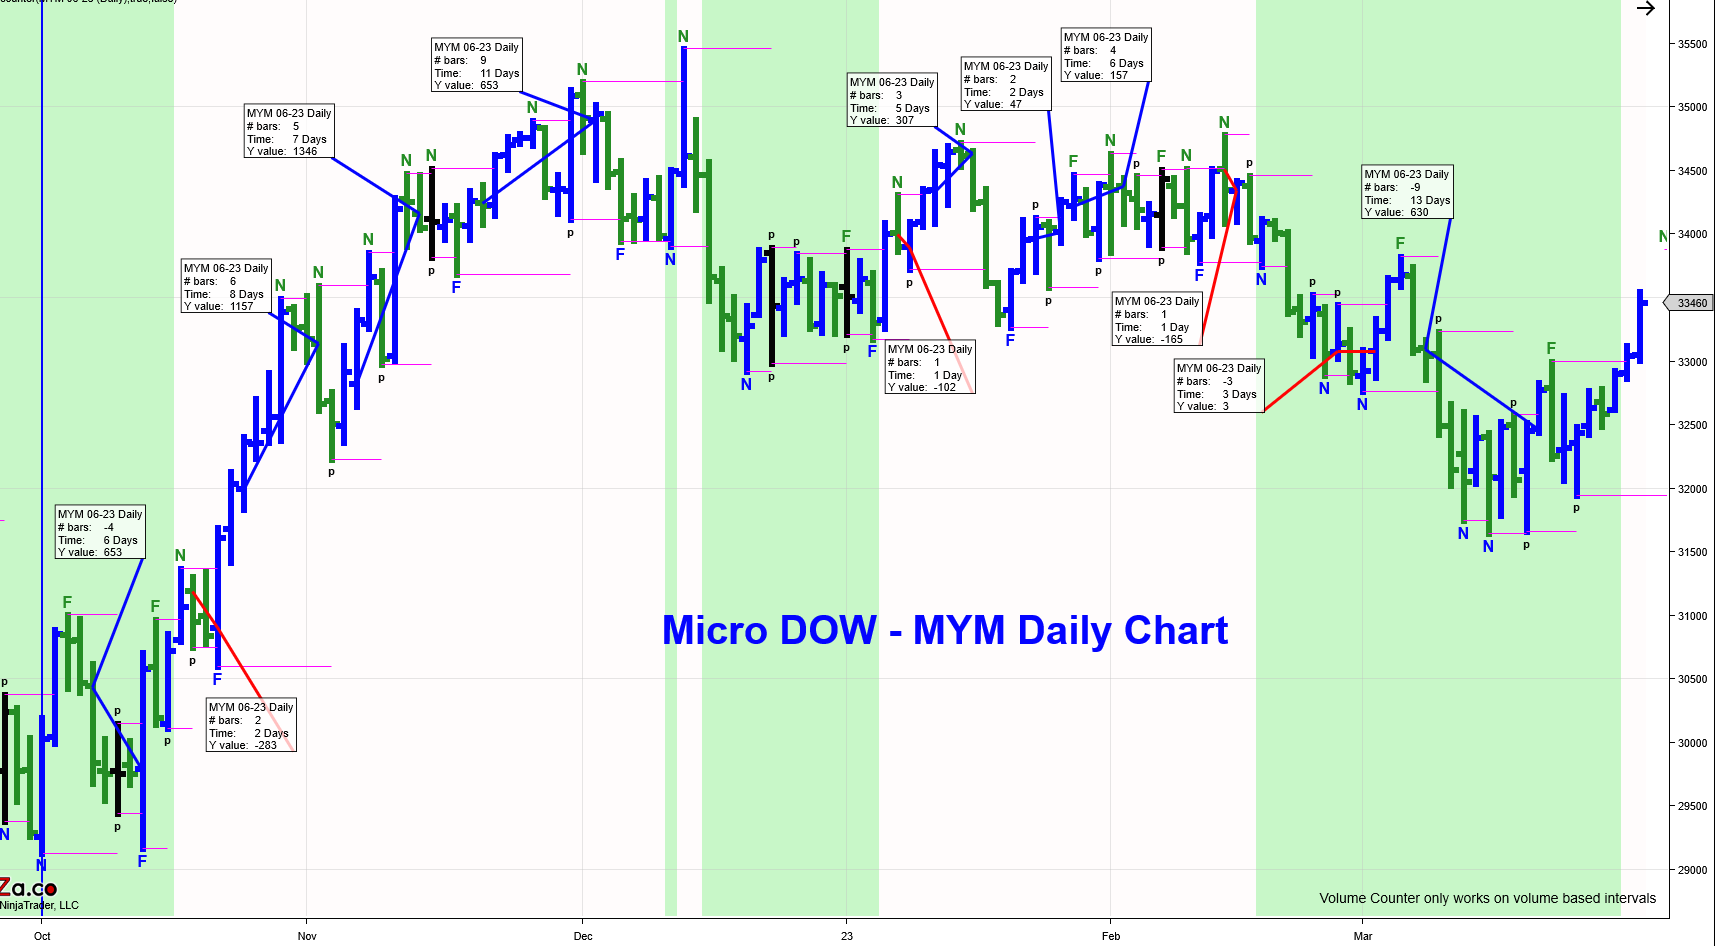
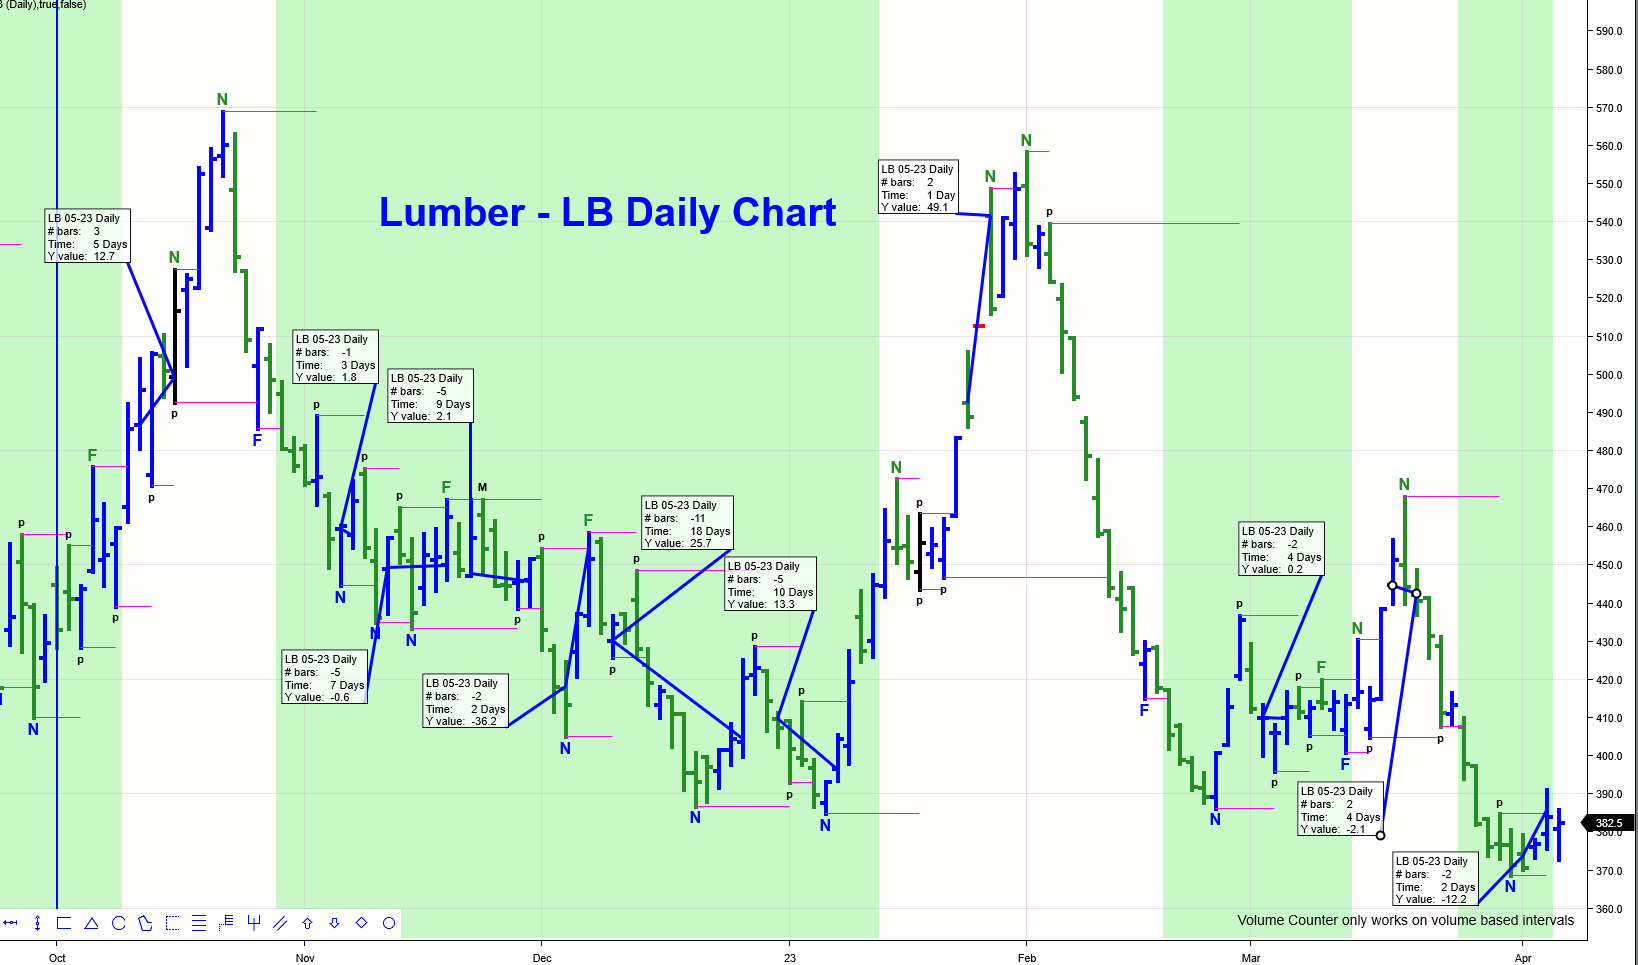
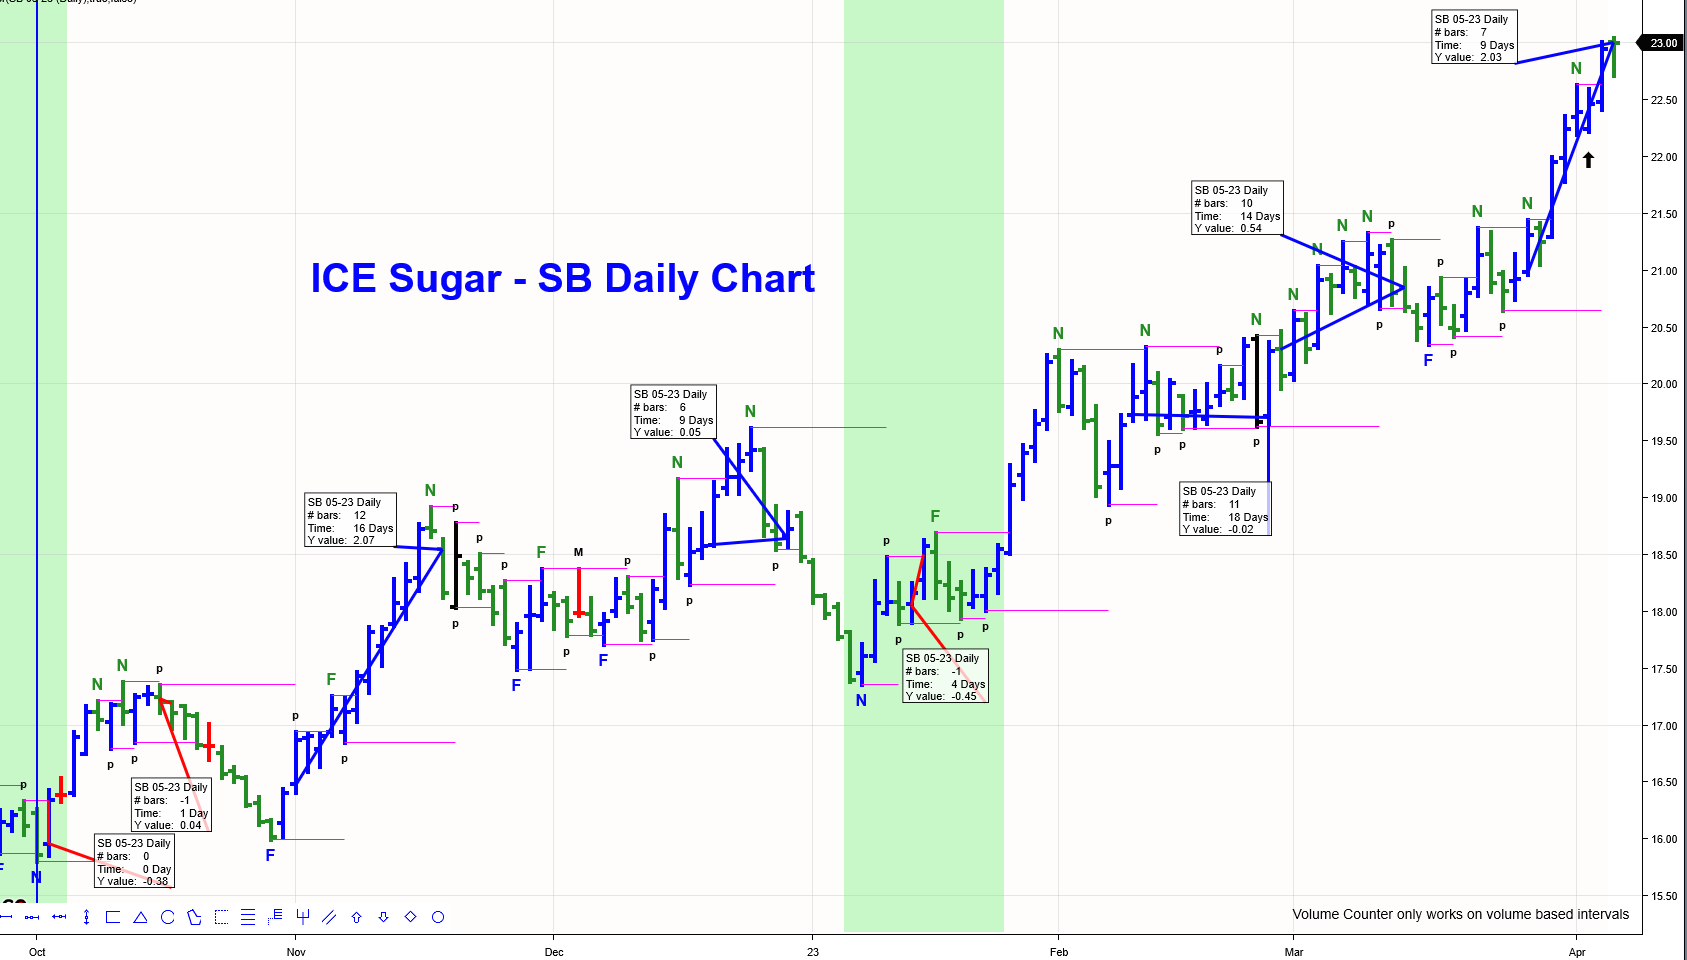
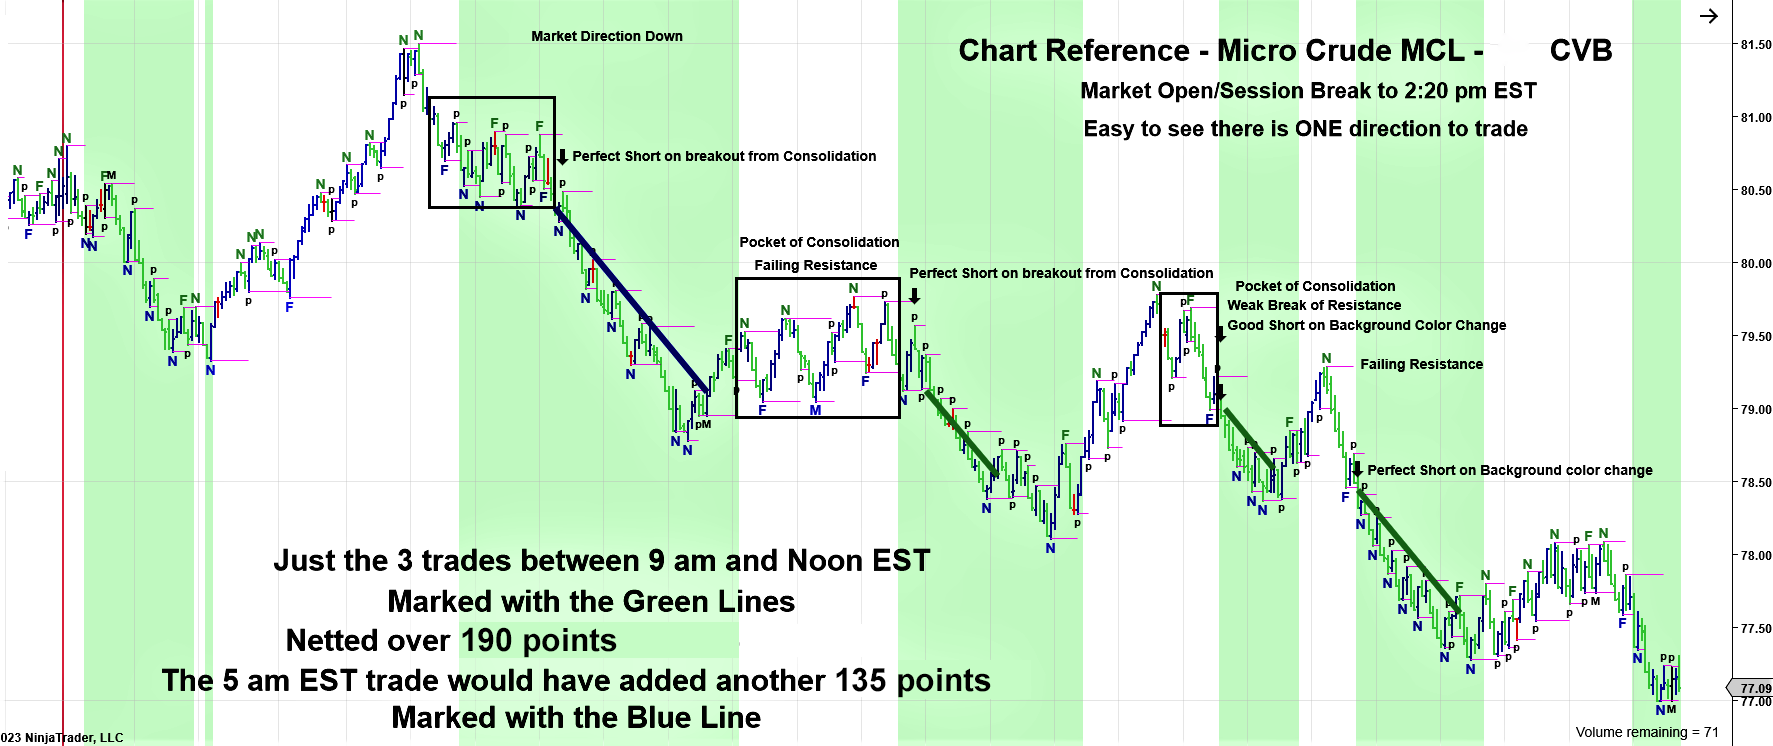
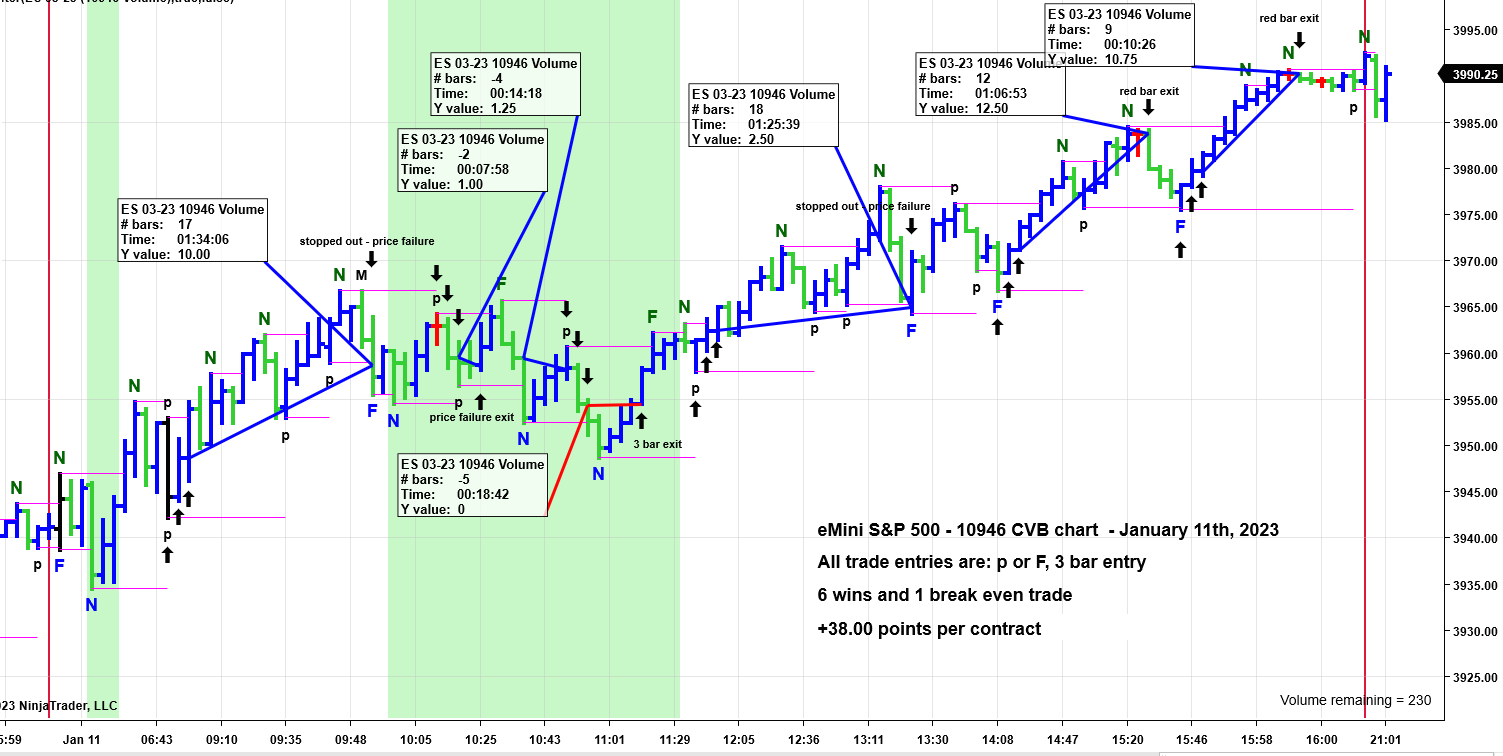
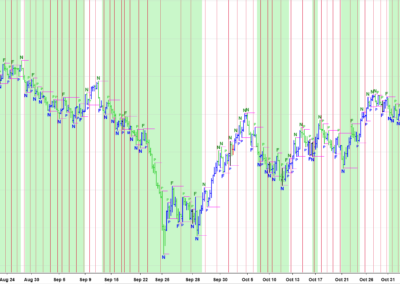
The PRICEPhysics™ GUI (Graphical User Interface) is a learning tool created to help everyday traders better understand the natural flow and movement of price on nearly all tradeable instruments but actually allows you to SEE natural price flow. No Guru needed. The PRICEPhysics™ GUI provides a real-time overlay that can be applied to various trading instruments to help traders visually see natural momentum, pure support/resistance points, and visually clear failures of those support/resistance points. NO INDICATORS NEEDED. All labeled points on the chart, background (direction) color changes, and bar attributes are ALL taken from the bars themselves and confirmed within a single bar OR FASTER.
You can prove it for yourself and they don’t want you to do that.
Why Constant Volume Bars?
In traditional trading environments, price movement is displayed in a standard second, minute, hourly, or daily increment. Since price is incremented in time, traditional trading environments create a level of inconsistency. You may ask why would this create inconsistencies? Simply put, no two sections of time are the same. This is not the case with Constant Volume Bars (CVB) Charts, CVB’s solve the issue with charts being displayed in time. Each bar represents a set amount of contracts, displaying price movement perfectly.
Price movement is universal, price moves the same wherever you look! This makes PRICEPhysics GUI essential to every trader’s toolbelt.
Click A Chart To Zoom In
After your purchase, you will be given the ability to download the PRICEPhysics GUI and a PDF of “The Science & Logic of Chart Reading” by William Schamp which will assist you in learning how to use the GUI.
All PRICEPhysics GUI subscribers also have access to a Subscribers Only section of the PRICEPhysics.
What’s in the Subscribers Only section:
• Full list of all the components of the PRICEPhysics GUI and definitions
• Logical Trade Set-Ups, Entries, Stops, & Exits using the PRICEPhysics GUI
• Subscriber Only PRICEPhysics GUI Instructional Videos
• More Coming Soon!
Once your order has finished processing, we will link your submitted NinjaTrader Machine ID to allow the use of the PRICEPhysics GUI. This process takes less than 48 hours and an email will be sent upon activation.
Refund and Sales Policy
All sales are final and non-refundable. If you have any questions please contact us before completing a purchase.
Product licenses can only be used on the purchaser’s computer/computers. Extra product licenses cannot be given away for free or resold. All subscriptions receive future software updates for free.
Need More Information?
Check Out Frequently Asked Questions
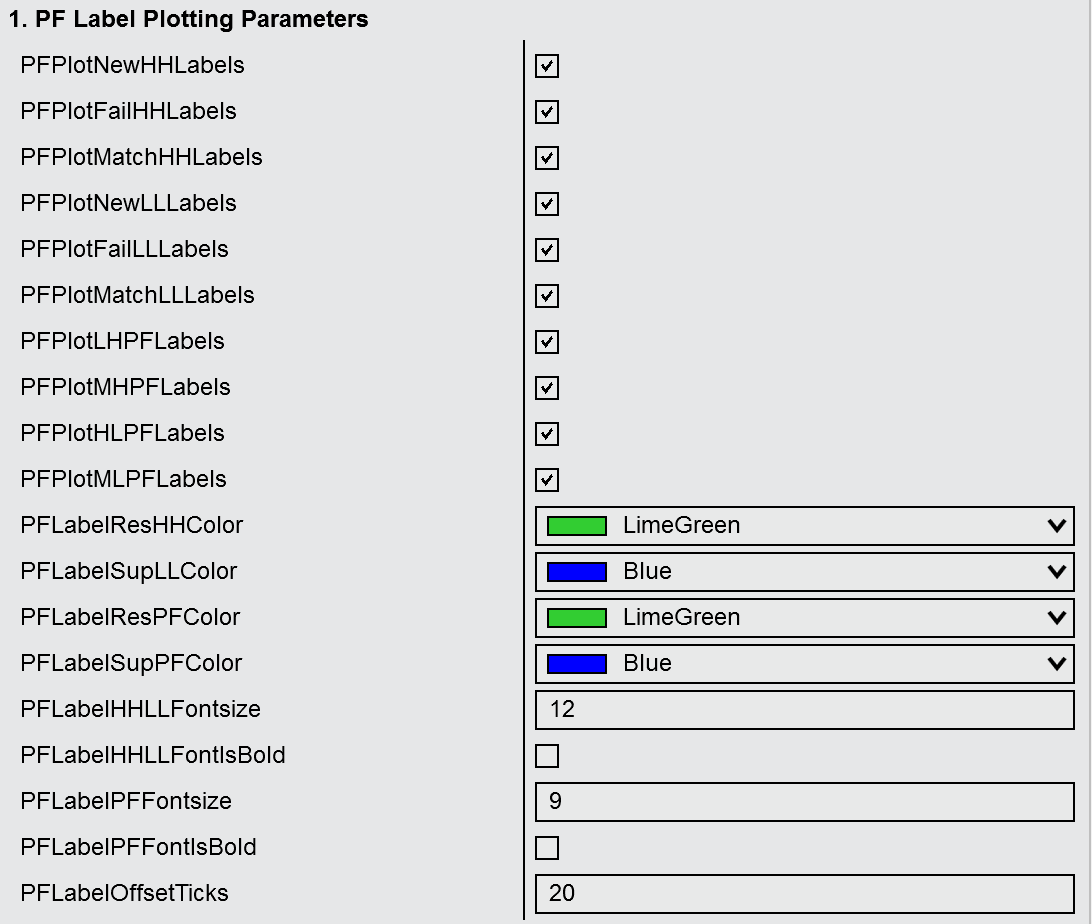
PRICEPhysics GUI Customizable Settings
All settings in the PRICEPhysics GUI are fully customizable to give you complete control over your charts
What you can customize:
- PF Label Plotting & Color
- PF Price Bar Colors
- PF Breakout Colors
- PF Market Direction Colors

