Constant Volume Bar Charts versus Traditional Time Charts
Constant volume bar charts are a type of chart used in financial trading that displays price data in the form of bars, with each bar representing a fixed volume of trades rather than a fixed period of time. This type of chart is designed to help traders identify trends and patterns in the market by focusing on the volume of trades rather than the time frame in which they occurred.
One of the main benefits of constant volume bar charts is that they can provide a clearer and more accurate representation of market activity, as they do not depend on the varying volume of trades that occurs over time. This can make it easier for traders to identify trends and make informed trading decisions, as they can focus on the volume of trades rather than being influenced by the time frame in which they occurred.
Another advantage of constant volume bar charts is that they can help traders to identify key levels of support and resistance, as they can more clearly identify changes in the volume of trades and the corresponding price movements. This can be particularly useful for traders who are looking to enter or exit positions at specific points in the market, as they can more easily identify key price levels and the corresponding volume of trades.
Overall, constant volume bar charts can be a useful tool for traders looking to gain a clearer understanding of market activity and make informed trading decisions. By focusing on the volume of trades rather than the time frame in which they occurred, traders can more easily identify trends and patterns in the market and make decisions based on real-time market data.

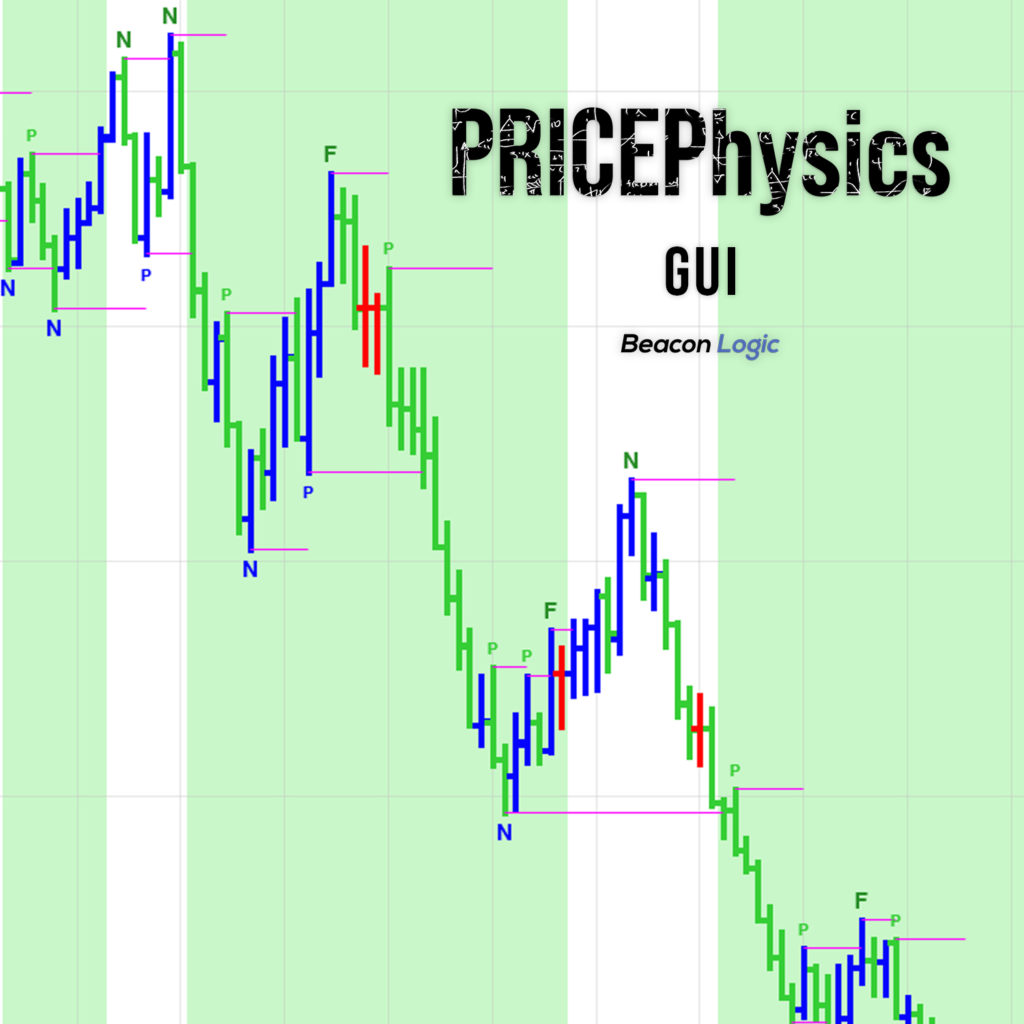
ES Constant Volume Bar Chart with PRICEPhysics GUI applied.